Gaschen L, Schur D, Kearney M. Contrast harmonic ultrasound imaging of the normal pancreas and pancreatitis in dogs. Proceedings of ACVR Annual Scientific Meeting 2007 Nov 27–Dec 1; Chicago, IL


Article added / Artikel hinzugefügt 01.10.2021
Generally Articles and Discussions about Osteosarcoma in Dogs
→ Evaluations of phylogenetic proximity in a group of 67 dogs with
osteosarcoma: a pilot study
Article added / Artikel hinzugefügt 01.10.2021
Generally Articles and Discussions about Osteosarcoma in Dogs
→ Canine Periosteal Osteosarcoma
Images added / Abbildungen hinzugefügt 02.05.2019
Generally Sonography Atlas of Dogs →
Cardiovascular system → Pulmonary vessels
New subcategory added / Neue Unterkategorie hinzugefügt 02.05.2019
Generally Sonography Atlas of Dogs →
Cardiovascular system → Pulmonary vessels
Images added / Abbildungen hinzugefügt 01.05.2019
Generally Sonography Atlas of Dogs →
Cardiovascular system → Heart valvular diseases


Quantitative Contrast-enhanced Ultrasonographic Assessment of Naturally Occurring Pancreatitis in Dogs

Lim, S.Y., Nakamura, K., Morishita, K., Sasaki, N., Murakami, M., Osuga, T., Yokoyama, N., Ohta, H., Yamasaki, M. and Takiguchi, M. (2015), Quantitative
Contrast-enhanced Ultrasonographic Assessment of
Naturally Occurring Pancreatitis in Dogs. Journal of
Veterinary Internal Medicine, 29: 71–78.
doi: 10.1111/jvim.12470

Abstract
Background
Quantitative contrast-enhanced ultrasonography (CEUS) can detect pancreatic perfusion changes in experimentally induced canine pancreatitis. However, its usefulness in detecting perfusion changes in naturally occurring pancreatitis is unclear.
Hypothesis/Objectives
To determine the feasibility of using CEUS to detect pancreatic and duodenal perfusion changes in naturally occurring canine pancreatitis.
Animals
Twenty-three client-owned dogs with pancreatitis, 12 healthy control dogs.
Methods
Dogs diagnosed with pancreatitis were prospectively included. CEUS of the pancreas and duodenum were performed. Time-intensity curves were created from regions of interest in the pancreas and duodenum. Five perfusion parameters were obtained for statistical analyses: time to initial up-slope, peak time (Tp), time to wash-out (TTW), peak intensity (PI), and area under the curve (AUC).
Results
For the pancreas, Tp of the pancreatitis group was prolonged when compared to controls (62 ± 11 seconds versus 39 ± 13 seconds; P < .001). TTW also was prolonged but not significantly (268 ± 69 seconds versus 228 ± 47 seconds; P = .47). PI and AUC were increased when compared to controls (95 ± 15 versus 78 ± 13 MPV; P = .009 and 14,900 ± 3,400 versus 11,000 ± 2,800 MPV*s; P = .013, respectively). For the duodenum, PI and AUC were significantly increased in the pancreatitis group when compared to controls.
Conclusions and Clinical Importance
Contrast-enhanced ultrasonography can detect pancreatic perfusion changes in naturally occurring canine pancreatitis characterized by delayed peak with prolonged hyperechoic enhancement of the pancreas on CEUS. Additionally, duodenal perfusion changes secondary to pancreatitis were observed.
Abbreviations
- AP
-
acute pancreatitis
- AUC
-
area under the curve
- AUROC
-
area under the receiver operating characteristic curve
- CEUS
-
contrast-enhanced ultrasound
- CT
-
computed tomography
- MB
-
microbubble
- MPV
-
mean pixel value
- PI
-
peak intensity
- ROC
-
receiver operating characteristic
- ROI
-
region of interest
- TIC
-
time-intensity curve
- Tp
-
peak time
- TTU
-
time to initial up-slope
- TTW
-
time to wash-out
- US
-
ultrasound
Diseases of the exocrine pancreas are common in companion animals, and pancreatitis is the most common exocrine disease seen in dogs. Clinical signs exhibited by patients with pancreatitis are often nonspecific and not pathognomonic for this disease.[1, 2] Therefore, differentiation among acute, chronic, and acute-on-chronic pancreatitis is difficult in clinical situations because of similarities in their clinical presentation.[1, 2] Currently available diagnostic modalities for pancreatitis include measurement of pancreatic enzymes, diagnostic imaging, cytology and histopathology, with the first 2 being most commonly utilized in clinical practice. Accurate clinical diagnosis of pancreatitis remains challenging and new diagnostic methods are needed because no single noninvasive diagnostic method is completely reliable for the diagnosis.
Diagnostic imaging such as abdominal ultrasonography is useful for the diagnosis of pancreatitis.[3] Typical findings of an enlarged, hypoechoic pancreas with surrounding hyperechoic mesentery are suggestive of pancreatitis.[3] A hyperechoic pancreas can be associated with chronic pancreatitis because of the presence of pancreatic fibrosis.[4] However, these findings may not be apparent in mild or subclinical pancreatitis. Reported sensitivity of ultrasound (US) for the diagnosis of pancreatitis remains at 68%, and a normal US examination does not rule out pancreatitis.[1, 3] Other diagnostic imaging modalities such as computed tomography (CT) and magnetic resonance imaging have been used to evaluate and characterize the severity of pancreatitis in people.[5] The use of CT in the diagnosis of pancreatitis in dogs has been reported in a small number of dogs.[6, 7] Recently, a new development in CT imaging called perfusion CT has been useful to detect changes in pancreatic perfusion in various clinical situations (including inflammation and neoplasia) in people.[8-10] The usefulness of this technique has not yet been evaluated in veterinary medicine. However, general anesthesia or deep sedation typically is needed for CT examination in veterinary patients.
Contrast-enhanced ultrasound (CEUS) is a new breakthrough for diagnostic imaging in people and its application in veterinary medicine is growing steadily in recent years.[11, 12] Perfusion of various abdominal organs such as the liver, spleen, pancreas, kidney, and adrenal glands can be studied noninvasively using CEUS.[12-17] Applications of CEUS in the diagnosis of pancreatic neoplasia also have been reported in veterinary medicine.[18, 19] CEUS utilizes microbubble (MB) contrast agents that remain entirely intravascular when administered IV, with no extravasation into surrounding tissue.[11] Subtraction techniques such as pulse inversion imaging, used in contrast-specific imaging techniques, enhances detection of harmonic echoes from MB while suppressing echoes from tissue.[11] Therefore, the contrast enhancement reflects perfusion of the organ and can differentiate areas of inflammation (hyperechoic enhancement) and necrosis (nonenhancement).[11, 12, 20, 21] CEUS has been reported to be comparable to CT in the assessment of acute pancreatitis (AP) in people.[22] Recently, we also have reported the feasibility of using quantitative CEUS to detect pancreatic perfusion changes in experimentally induced AP in dogs.[23] However, reports on the usefulness of CEUS in detecting perfusion changes in naturally occurring pancreatitis in dogs are few.[7],1
The purpose of this study was to determine the feasibility of using quantitative CEUS to detect pancreatic and secondary duodenal perfusion changes in naturally occurring pancreatitis in dogs. We hypothesized that quantitative CEUS would detect pancreatic and secondary duodenal perfusion changes as possible signs of inflammation in naturally occurring pancreatitis in dogs. If this hypothesis were to be true, quantitative CEUS potentially could be useful as a new diagnostic tool in diagnosing pancreatitis in dogs.
Materials and Methods
Patients
This study was performed with approval from the Hokkaido University Animal Care and Use Committee. Client-owned dogs that were presented to Hokkaido University Veterinary Teaching Hospital between September 2011 and December 2013 for pancreatitis were prospectively enrolled. Diagnosis of pancreatitis was based on (1) presence of ≥1 acute clinical signs (<2 weeks; eg, vomiting, anorexia, lethargy) and ≥1 physical examination findings associated with pancreatitis (eg, abdominal pain, jaundice, dehydration), (2) abnormal pancreatic lipase immunoreactivity (Spec cPL > 400 μg/L), and (3) presence of ≥1 abdominal US findings consistent with pancreatitis (eg, enlarged, irregular, hypoechoic pancreas; surrounding hyperechoic mesentery). Inclusion criteria were: owner's consent and unobstructed visualization of the pancreas on US. Exclusion criterion was presence of other primary diseases (eg, gastrointestinal, hepatobiliary, urinary) that may be responsible for the clinical signs.
To obtain reference parameters, data from 12 normal controls (including 8 historical normal controls) were included.[24] These laboratory-owned dogs (7 mixed breed and 5 Beagle) were healthy based on physical examination findings, normal CBC and serum biochemistry (including lipase and C-reactive protein), and abdominal US findings.
B-mode US and CEUS
The clinician responsible for the case performed the B-mode US examination. A different operator (LSY), who was not blinded to the US findings, performed the CEUS examination. CEUS was performed after at least a 6-hour fast. The location for CEUS imaging was predetermined during the initial B-mode US. If the pancreatic abnormality was generalized or localized to the right lobe, CEUS of the right pancreatic lobe was performed using a right intercostal approach. The adjacent descending duodenum was imaged simultaneously with the right pancreatic lobe, in a single US view, to investigate secondary perfusion changes in the duodenum. If the pancreatic abnormality was localized elsewhere (eg, pancreatic body or left lobe), CEUS of that area was performed instead.
An US scanner (Aplio XG2 ) with a 7–14 MHz broadband linear probe (PLT-1204 AT2) was used for B-mode US. A 5–11 MHz broadband linear probe (PLT-704 AT2) suitable for pulse subtracting imaging was used for CEUS. Technical parameters were: low mechanical index of 0.20–0.21 for minimal MB destruction, focus depth placed below the pancreas, B-mode and contrast imaging gain set at 100 dB and 75 dB, respectively, and US imaging set at 30–31 frames/s. Images were recorded in 40-second cine-loops to a hard disk for additional off-line analysis.
Microbubble contrast agent3 at a dosage of 0.05 mL/kg diluted in 3 mL (dogs <3 kg) or 5 mL (dogs >3 kg) of saline was administered as a continuous infusion over 1 minute.[24] A syringe pump4 was used to infuse the MB contrast agent through an IV catheter placed in the cephalic vein. The timer on the US machine was started simultaneously with infusion of MB contrast agent. Scanning was performed for 5 minutes from the start of contrast agent infusion for generation of a time-intensity curve (TIC).
Quantitative Analysis
A single operator (LSY) performed the quantitative analysis of the CEUS images using an image analysis system.5 This system measures the tissue intensity using a gray-scale level ranging from 0 to 255 mean pixel value (MPV).
One image per second for the first 2 minutes and then 1 image at an interval of every 10 seconds until 300 seconds from the start of MB contrast agent infusion were analyzed. In each image, a region of interest (ROI) containing 300–600 pixels,[16, 23, 24] was manually placed in the pancreatic parenchyma and duodenal mucosa (if available) for measurement of tissue intensity. When respiratory or patient motion was encountered, the ROI was adjusted to maintain similar position within the pancreas and duodenum. TICs (Fig 1), depicting the change in tissue intensity of the ROIs over time, were created. From the TIC, time parameters corresponding to blood flow velocity, and intensity parameters corresponding to blood volume were evaluated. Time parameters included time to initial up-slope (TTU) and peak time (Tp), reflecting wash-in and time to wash-out (TTW), reflecting wash-out of MB from the ROI. Intensity parameters include peak intensity (PI), reflecting maximum contrast enhancement and area under the curve (AUC), reflecting the amount of MB flowing through the ROI over 300 seconds.
Figure 1. TICs showing mean pixel intensity in the pancreatic parenchyma of pancreatitis group (solid black line) and control group (dashed black line). TIC of the pancreatitis group is similar in shape, but is higher in intensity, and peaked at a later time when compared to control group. The wash-out also is more gradual in the pancreatitis group. TIC, time-intensity curve; MPV, mean pixel value.

Statistical Analysis
Statistical analysis programs (JMP Pro 10 and SAS 9.26 ) were used for statistical analysis. Normality of data was assessed using kurtosis and skewness. When distribution approached normality, measured parameters of the pancreas and duodenum from dogs with pancreatitis and controls were compared using Student's t-test and Bonferroni correction was applied to account for multiple comparisons. Non-normally distributed data were compared using the Wilcoxon rank sum test. Receiver operating characteristic (ROC) curves were constructed to determine the optimal cut-off values for each measured parameter of the pancreas. To compare the performance of these parameters, the area under the ROC curves (AUROC) were compared using the method of DeLong et al.[25] The most optimal cut-off value was determined by the one with highest Youden's Index. The cut-off values obtained were applied and sensitivities and specificities were calculated for each measured parameter. A P-value of <.05 was considered statistically significant.
Results
Animals
A total of 23 dogs satisfying our inclusion criteria were included. Signalment of dogs in the pancreatitis and control group is summarized in Table 1. Dogs in the pancreatitis group were significantly older and weighed less than dogs in the control group (P < .001 and P = .0012, respectively).

The most common clinical sign was anorexia or inappetence (21/23; 91%), followed by lethargy (19/23; 83%), vomiting (15/23; 65%), weight loss (11/19; 58%), and diarrhea (13/23; 57%). Selected serum biochemistry results of dogs in the pancreatitis and control groups are summarized in Table 1. Ninety-one percent (21/23) of dogs had concurrently increased lipase activity, C-reactive protein, and Spec cPL concentration >400 μg/L.
B-mode US Findings
Ultrasonographic abnormalities were observed in the right pancreatic lobe in 22 dogs, in the pancreatic body in 10 dogs, and in the left lobe in 6 dogs. The pancreatic parenchyma was diffusely hypoechoic in 9 dogs, diffusely hyperechoic in 2 dogs, and nonhomogeneous in 12 dogs. In 1 dog, a hypoechoic area with irregular margin was observed within the pancreatic parenchyma. Twenty-two dogs had an enlarged pancreas, 20 had irregular pancreatic margins, 10 had hyperechoic peripancreatic mesentery, and 10 had duodenal corrugations.
CEUS Findings
Contrast-enhanced ultrasonography was performed at the right pancreatic lobe and adjacent descending duodenum in 21/23 dogs, and at the right pancreatic lobe only and pancreatic body in each of the remaining 2 dogs. CEUS was performed without sedation in control dogs. In the pancreatitis group, 6 dogs received analgesia as part of treatment for pancreatitis before CEUS. CEUS images of the pancreas in 20/23 dogs with pancreatitis and in all 12 control dogs were satisfactory, and were included for quantitative analysis. CEUS images of the duodenum in 18 dogs with pancreatitis and in 9 control dogs were satisfactory, and also were included for quantitative analysis. CEUS data from 3 dogs with pancreatitis were excluded from quantitative analysis because of CEUS of insufficient quality (n = 2) and inability to visualize the pancreas during the entire duration of CEUS (n = 1).
The TIC (Fig 1) of the pancreas in the pancreatitis group differed from that of the control group, and corresponded with the perfusion changes observed visually. In the control group, the craniopancreaticoduodenal artery was enhanced first, followed by the pancreatic parenchyma, and then the duodenal mucosa. Contrast wash-in to PI was gradual, followed by a plateau, and then a slow wash-out was observed. In the pancreatitis group, this order of enhancement was unchanged. However, contrast wash-in to PI was delayed. The pancreatic parenchyma was intensely enhanced for a longer period of time, resulting in a slower wash-out. In some dogs, fine pancreatic capillaries within the pancreatic parenchyma were more prominently enhanced when compared to control dogs (Fig 2A). The duodenum, which was simultaneously imaged with the pancreas, also was more intensely enhanced with a prolonged wash-out in dogs with pancreatitis compared to control dogs. Visually, PI of the duodenum was not different from that of the pancreas.
Figure 2. Contrast-enhanced ultrasonography images of the transverse view of the right pancreatic lobe (p) and mucosa of the descending duodenum adjacent to the right pancreas (d) (both outlined by dotted lines) in 2 representative dogs with pancreatitis (dorsal to the left, ventral to the right, medial to the bottom). (A) Image acquired at 69 seconds after start of contrast agent infusion showing the pancreas at peak intensity. The pancreas is swollen with irregular outlines, and is enhanced nonhomogeneously. Apart from the cranial pancreaticoduodenal vein (v) normally seen, fine pancreatic capillaries are also more prominently enhanced (arrows). Clinical signs of vomiting ceased and activity improved after 4 days of hospitalization and medical treatment. Lipase activity returned to reference range within 10 days. (B) Image acquired at 67 seconds after start of contrast agent infusion showing 2 nonenhancing lesions (arrowheads) in the pancreatic parenchyma. This dog recovered from the acute episode of pancreatitis and was discharged after 10 days of hospitalization and medical treatment. However, lipase activity and C-reactive protein did not return to reference ranges until 46 days and 25 days, respectively.
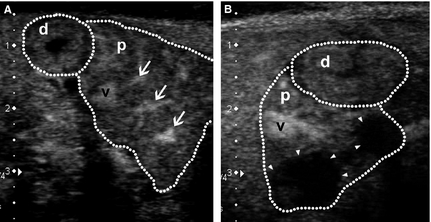
In 4 dogs, nonenhancing lesions suggestive of areas of necrosis were observed (Fig 2B). A single nonenhancing lesion was seen in 2 dogs, whereas multiple nonenhancing lesions were observed in the remaining 2 dogs. Dimensions of these nonenhancing lesions on CEUS were smaller in 2 dogs, similar in 1, and larger in 1 when compared to the corresponding hypo- to isoechoic pancreatic area on B-mode US.
Statistical Analysis
Values of measured parameters, reflecting pancreatic and duodenal perfusion are summarized in Table 2. For the pancreas, Tp of the pancreatitis group was significantly prolonged when compared to the control group (P < .001). PI and AUC also were significantly increased when compared to the control group (P = .009 and P = .013, respectively). TTW was prolonged in the pancreatitis group but not significantly (P = .47). For the duodenum, PI and AUC were significantly increased when compared to the control group (P = .005 and P = .045, respectively).

Table 3 shows the results of the ROC analysis. Tp produced the highest value for the area under ROC curve (AUROC) followed by PI and AUC. Cut-offs were determined based on the ROC curves. Tp ≥ 48 seconds resulted in sensitivity of 90% and specificity of 83% in detecting the presence of pancreatitis. PI ≥ 87 MPV resulted in sensitivity of 80% and AUC ≥ 13,700 MPV*s resulted in specificity of 83%.

Discussion
Contrast-enhanced ultrasonography is an effective and noninvasive method for quantification of pancreatic perfusion.[20, 23] In this study, CEUS detected pancreatic perfusion changes in naturally occurring pancreatitis, as demonstrated by the differing TIC. Measured parameters Tp, PI, and AUC of the pancreas were significantly different from normal controls. Quantification of these parameters enabled differentiation of dogs with pancreatitis from controls. Concurrent secondary duodenal perfusion changes also were observed in the pancreatitis group.
Visually, the pancreas of dogs in the pancreatitis group took a longer time to reach higher PI, and remained contrast-enhanced longer. The duodenum also showed similar patterns of increased echogenicity on CEUS. These visual changes may be subtle in some cases, and assessment depends on the subjective impression of the examiner. Therefore, visual assessment is greatly affected by inter-observer variations or presence of bias. Quantifying the perfusion using TIC and measured parameters allows objective analysis of pancreatic perfusion.[12, 26]
In our study, pancreatic perfusion parameters PI and AUC of the pancreatitis group were significantly higher than controls. These findings were consistent with those previously reported by the authors in cerulein-induced AP in dogs.[23] Additionally, Tp also was significantly delayed in the pancreatitis group. TTW of the pancreatitis group also was prolonged but not significantly. Perfusion changes also were observed in duodenum of dogs in the pancreatitis group. PI and AUC were significantly increased when compared to controls. This observation is in contrast with results previously reported in cerulein-induced AP in dogs, where no perfusion changes secondary to pancreatitis were observed in the duodenum.[23] Perfusion changes seen in this study could be because of the presence of microcirculatory derangements in the duodenum from local inflammatory effects of pancreatitis, which were not present in cerulein-induced AP as a result of the short time period of pancreatic insult, but present in naturally occurring pancreatitis.[23]
In particular, measured parameters Tp, PI, and AUC of the pancreas produced the highest AUROC (Table 3). Applying specific cut-off values obtained from the ROC curve for Tp enabled detection of pancreatitis with good sensitivity and specificity, whereas PI and AUC had good sensitivity and specificity, respectively.
The changes observed in pancreatic perfusion parameters might be associated with microvascular changes seen in the inflamed pancreas.[27] In experimentally induced AP in dogs, gross reductions in the number of capillaries with dilatation of the remaining microvasculature are observed. In addition, capillaries with obliterated ends and irregular arrangements also are observed using scanning and transmission electron microscopy.[27] These microvascular changes may lead to accumulation of trapped MB within the obliterated ends in addition to constant influx of new MB, thus increasing the PI. Slower wash-out of these trapped MB resulted in a pancreas that was visually contrast-enhanced for a longer period of time, and was reflected objectively by prolonged TTW and increased AUC in this study.[23] Previous CEUS studies on pancreatitis in people and dogs also have reported a similar increase in contrast enhancement of the pancreatic parenchyma.[21],1 Delayed Tp may be associated with dilated and tortuous capillaries that required more time for MB to accumulate to PI.
In 4 dogs, nonenhancing pancreatic parenchymal lesions were identified on CEUS. The enhancement characteristics of these lesions (nonenhancement) on CEUS suggest areas of pancreatic ischemia or necrosis instead of neoplasia such as pancreatic insulinoma (hypo-enhancement or hyper-enhancement) or adenocarcinoma (hypo-enhancement).[18-20, 22] However, histopathologic confirmation was not available in this study. Although development of pancreatic necrosis indicates a poor prognosis in human patients with AP,[22] patient prognosis was good in the present study. All 4 dogs survived and recovered from pancreatitis with admission into the intensive care unit and appropriate medical treatment. A recent study on CEUS of dogs with AP also reported a good prognosis in patients with nonenhancing pancreatic lesions.[7] This observation could be because of recruitment of patients with milder forms of pancreatitis in our studies or differences in the disease process between humans and dogs.
Perfusion change of the duodenum secondary to pancreatitis also was investigated in this study. In CEUS of normal dogs, the PI of the pancreas and duodenum is almost equal.[15, 24] In contrast with a previous report of experimental AP in dogs, in which no secondary CEUS changes were detected in the duodenum,[23] perfusion changes were detected in this study. Because both organs were more intensely enhanced in dogs with pancreatitis, real-time visual comparison during CEUS examination was not feasible. Therefore, quantitative analysis of duodenal enhancement on CEUS, and subsequent comparison with a control group should be performed for objective comparison. In cases in which perfusion of the pancreatic parenchyma and duodenum increases concurrently, without presence of primary gastrointestinal disease, suspicion of pancreatitis also should increase.
Contrast-enhanced ultrasonography was possible in 20/23 (87%) dogs in this study and can be performed relatively easily after B-mode US examination. In this study, however, CEUS images were not satisfactory in 3 dogs. One dog was uncooperative during CEUS examination and excessive patient movement was encountered. In another dog, duodenal gas obscured pancreatic imaging during CEUS. In the last dog, overall poor contrast enhancement of abdominal organs was observed, resulting in images that were of insufficient quality for analysis.
A few limitations were present in our study. First, this sample was derived from a single institution resulting in a small sample size. Second, dogs enrolled into this study consisted mainly of small- to medium-sized dogs, which differed from the control group. This limitation was because of overrepresentation of small- to medium-sized dogs among Japanese pet owners or possibly that smaller dogs are more likely to develop pancreatitis. Additionally, dogs in the pancreatitis group were significantly older than the control group. Although differences in size and age can influence perfusion of the pancreas, the changes observed in the pancreatitis group in this study were paradoxical to the perfusion pattern changes in older patients and smaller sized dogs. Pancreatic perfusion decreases with age in people, and smaller sized dogs typically show faster Tp than medium-sized dogs.[15, 28] Thus, the perfusion changes seen in this study likely were because of the underlying pancreatic pathology. Third, we did not perform histopathology for the definitive diagnosis and classification of pancreatitis. Histopathology to rule out mild enteropathy that could have influenced duodenal perfusion also was lacking. Although only dogs with acute onset of clinical signs were enrolled in this study, differentiation of dogs with acute, chronic, or acute-on-chronic pancreatitis cannot be made based on clinical signs.[1, 2] The possible mixture of such cases may be the reason why there was overlap in some of the measured parameters. In experimental pancreatitis, perfusion changes were observed on CEUS acutely after pancreatic insult and returned to baseline values with time.[23] In this study, because patients were presented to the hospital at various times after first showing clinical signs, CEUS inevitably was performed at different stages of pancreatic inflammation. Fourth, the clinicians managing these cases had different levels of experience, resulting in varying ability to visualize the pancreas on US as well as to rule out the presence of other diseases that could have contributed to clinical signs and serum biochemical changes. Fifth, we did not have Spec cPL results in the control dogs to rule out the presence of mild or subclinical pancreatitis. Nevertheless, control dogs were clinically healthy and did not show any clinical signs suggestive of pancreatitis before or after CEUS studies were carried out.
Additional research with histologic diagnosis and classification of types of pancreatitis is warranted, but this is difficult in clinical settings where biopsy samples often are not obtained. CEUS also may be potentially useful in monitoring disease progression. Therefore, future research should include comparison of pancreatic perfusion before and after treatment. It also will be important to investigate how well CEUS can differentiate dogs with similar clinical signs but with nonpancreatic disease from dogs with pancreatitis. Additional study also is needed to clarify the superiority of CEUS to conventional B-mode US in the diagnosis of canine pancreatitis, especially in cases in which abnormal pancreatic lipase immunoreactivity is present, but pancreatic appearance on B-mode US is normal.
In conclusion, CEUS can be used in the dog for detecting pancreatic perfusion changes as a possible sign of pancreatic inflammation in naturally occurring pancreatitis. Naturally occurring pancreatitis was characterized by a delayed increase to PI and prolonged hyperechoic enhancement on CEUS. Quantifying pancreatic perfusion parameters can provide objective and valuable information in differentiating dogs with pancreatitis from normal dogs. When secondary perfusion changes occur concurrently in the duodenum, without primary gastrointestinal disease, suspicion of pancreatitis should increase. Quantitative CEUS may be useful as a noninvasive diagnostic tool in the diagnosis of naturally occurring pancreatitis in dogs.
Acknowledgments
This work was performed at Hokkaido University, Hokkaido, Japan, and was partially supported by the Grants-in-Aid for Scientific Research (no. 23580436) from the Japan Society for the Promotion of Science (M.T.). The authors thank Dr Yoichi Ito for assistance with the statistical analysis.
Conflict of Interest Declaration: The authors disclose no conflict of interest.
Off-label Antimicrobial Declaration: The authors declare no off-label use of antimicrobials.
Footnotes
-
1
-
2
Toshiba Medical Systems, Tochigi, Japan
-
3
Sonazoid; Daiichi-Sankyo, Tokyo, Japan
-
4
Top-5300; Top, Tokyo, Japan
-
5
ImageJ; US National Institutes of Health, Bethesda, MD
-
6
SAS Institute Inc, Cary, NC
References
-
1
, , , et al. Clinical, clinicopathologic, radiographic, and ultrasonographic abnormalities in dogs with fatal acute pancreatitis: 70 cases (1986–1995). J Am Vet Med Assoc 1998;213:665–670.
-
2
, , , et al. Chronic pancreatitis in dogs: A retrospective study of clinical, clinicopathological, and histopathological findings in 61 cases. Vet J 2013;195:73–79.
-
3
, . Sonographic evaluation of the normal and abnormal pancreas. Clin Tech Small Anim Pract 2007;22:115–121.
-
4
. Ultrasonography of the pancreas. Probl Vet Med 1991;3:583–603.
-
. Severe acute pancreatitis: Contrast-enhanced CT and MRI features. Abdom Imaging 2001;26:225–233.
-
6
, , , . Combined use of ultrasonography and contrast enhanced computed tomography to evaluate acute necrotizing pancreatitis in two dogs. Vet Radiol Ultrasound 2003;44:72–79.Direct Link:
-
7
, , , . Comparison between survery radiography, B-mode ultrasonography, contrast-enhanced ultrasonography and contrast-enhanced multi-detector computed tomography findings in dogs with acute abdominal signs. Vet Radiol Ultrasound 2013;54:591–604.
-
8
, , . Pancreatic perfusion CT in early stage of severe acute pancreatitis. Int J Inflam 2012;2012:497386.
-
9
, , , et al. Tissue perfusion in pathologies of the pancreas: Assessment using 128-slice computed tomography. Abdom Imaging 2012;37:595–601.
-
10
, , , . Perfusion measurement in acute pancreatitis using dynamic perfusion MDCT. AJR Am J Roentgenol 2006;186:114–118.
-
11
, , , et al. Ultrasound contrast agents: Properties, principles of action, tolerance, and artifacts. Eur Radiol 2001;11:1316–1328.
-
12
, . Review of clinical characteristics and applications of contrast-enhanced ultrasonography in dogs. J Am Vet Med Assoc 2009;234:460–470.
-
13
, , , et al. Contrast-enhanced ultrasonography for characterization of canine focal liver lesions. Vet Radiol Ultrasound 2010;51:79–85.al. Contrast-enhanced ultrasonography for characterization of focal splenic lesions in dogs. J Vet Intern Med 2010;24:1290–1297.
-
15
, , . Quantitative perfusion analysis of the pancreas and duodenum in healthy dogs by use of contrast-enhanced ultrasonography. Am J Vet Res 2012;73:385–392.
-
16
, , . Quantitative contrast ultrasound analysis of renal perfusion in normal dogs. Vet Radiol Ultrasound 2007;48:373–377.
-
17
, , , et al. Contrast-enhanced ultrasonographic evaluation of adrenal glands in dogs with pituitary-dependent hyperadrenocorticism. Am J Vet Res 2013;74:417–425.
-
18
, , , et al. Description of the use of contrast-enhanced ultrasonography in four dogs with pancreatic tumours. J Small Anim Pract 2014;55:164–169.
-
19
, , , et al. Contrast-enhanced ultrasonographic findings in three dogs with pancreatic insulinoma. Vet Radiol Ultrasound 2014. doi: 10.1111/vru.12177 [e-pub ahead of print].
-
20
, , , et al. Ultrasonography of the pancreas. 4. Contrast-enhanced imaging. Abdom Imaging 2007;32:171–181.
-
21
, , , et al. Quantitative analysis of tissue perfusion using contrast-enhanced transabdominal ultrasound (CEUS) in the evaluation of the severity of acute pancreatitis. Med Ultrason 2010;12:198–204.
-
22
, , , et al. Contrast-enhanced ultrasound in the staging of acute pancreatitis. Eur Radiol 2010;20:2518–2523.
-
23
, , , et al. Qualitative and quantitative contrast-enhanced ultrasonographic assessment of cerulein-induced acute pancreatitis in dogs. J Vet Intern Med 2014;28:496–503.Direct Link:
-
24
, , , et al. Qualitative and quantitative contrast enhanced ultrasonography of the pancreas using bolus injection and continuous infusion methods in normal dogs. J Vet Med Sci 2013;75:1601–1607.
-
25
, , . Comparing the areas under two or more correlated receiver operating characteristic curves: A nonparametric approach. Biometrics 1988;44:837–845.
-
26
, , , et al. Quantitative perfusion analysis of transabdominal contrast-enhanced ultrasonography of pancreatic masses and carcinomas. Gastroenterology 2009;137:1903–1911.
-
27
, , , et al. Three-dimensional morphological study of the pancreatic microvasculature in caerulein-induced experimental pancreatitis. Br J Surg 1989;76:853–855.Direct Link:
-
28
, . Age-dependent decline in parenchymal perfusion in the normal human pancreas: Measurement by dynamic computed tomography. Pancreas 1998;17:148–152.
Share this article / Teilen Sie diesen Artikel